
Class 9 Biology Chapter 11 Notes – Biostatistics (Punjab Boards, New Syllabus)
Looking for complete Class 9 Biology Chapter 11 notes that explain how biological data is collected and analyzed? This page brings together Biostatistics notes for Class 9 Punjab board students in one downloadable PDF — covering data collection, frequency distribution, measures of central tendency, and exam-style MCQs, short and long questions — prepared according to the new 2025-26 Punjab Textbook Board syllabus for all Punjab boards.
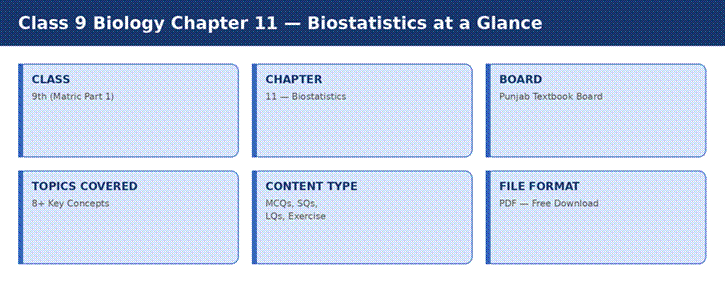
At-a-glance summary of the Class 9 Biology Chapter 11 notes
Chapter 11 Overview
Biostatistics is the final chapter of the Class 9 Biology book and introduces the statistical tools biologists use to collect, organize, and interpret data from biological and medical research. It is a numerical, calculation-based chapter, making it a reliable source of easy marks once the methods are understood. Here’s a quick snapshot, based on the new 2025-26 syllabus:
| Detail | Information |
| Class | 9th (Matric Part 1) |
| Subject | Biology |
| Chapter | Chapter 11 – Biostatistics (New Syllabus 2025-26) |
| Board | Punjab Textbook Board (PTB) – all Punjab boards |
| Notes Include | MCQs, Short Questions, Long Questions, Solved Exercise |
| File Format | PDF (free download) |
What You’ll Learn in This Chapter
Chapter 11 explains how raw biological data becomes usable information. The notes are organized around the following core ideas, each covered once so nothing is repeated:
What Is Biostatistics?
Biostatistics is the branch of statistics applied to biological, medical, and health-related data. This section explains its uses, such as evaluating the effectiveness of vaccines and setting priorities in public health programs.
Data Collection — Primary and Secondary Data
Data can be collected firsthand (primary data) or gathered from existing records (secondary data). This part also introduces sampling — selecting a representative group from a larger population for study.
Frequency Distribution
A frequency distribution organizes raw data into a table showing how often each value or range of values occurs. This section covers both ungrouped and grouped frequency distribution tables, and the idea of class intervals.
Graphical Representation of Data
Data is often easier to interpret visually. This part covers the main types of graphs used in biology — bar graphs, histograms, and frequency polygons — and when each is most appropriate.
Measures of Central Tendency — Mean, Median, and Mode
Central tendency values summarize a data set with a single representative number. This section explains how to calculate the mean (average), median (middle value), and mode (most frequent value) from both ungrouped and grouped data.
Mean vs. Median vs. Mode Comparison
Since board exams frequently ask students to differentiate between the three, here’s a quick side-by-side comparison:
| Feature | Mean | Median | Mode |
| Definition | Sum of values ÷ number of values | Middle value when data is ordered | Most frequently occurring value |
| Affected by extreme values | Yes, strongly | No | No |
| Best used when | Data has no extreme outliers | Data is skewed or has outliers | Data has a clear repeated value |
Measures of Dispersion
Central tendency alone does not show how spread out the data is. This added section introduces the range — the simplest measure of dispersion, calculated as the difference between the highest and lowest values — a concept frequently tested alongside mean, median, and mode but often left out of basic notes.
Note: This page focuses on notes structure and downloads. For full worked examples of frequency tables and mean/median/mode calculations, download the complete PDF using the link below.
What’s Included in These Notes
- Important definitions and key terms explained in simple language
- Complete Multiple Choice Questions (MCQs) with answer keys
- Short Questions (SQs) commonly asked in board papers
- Long Questions (LQs) with exam-style, structured answers
- Fully solved textbook exercise (objective and subjective parts)
- Worked examples of frequency tables, graphs, and central tendency calculations
Applicable For All Punjab Boards
These notes follow the new Punjab Textbook Board syllabus (2025-26), so they apply equally to students across every Punjab board:
| # | BISE Board |
| 1 | BISE Lahore |
| 2 | BISE Rawalpindi |
| 3 | BISE Faisalabad |
| 4 | BISE Gujranwala |
| 5 | BISE Multan |
| 6 | BISE Sargodha |
| 7 | BISE Bahawalpur |
| 8 | BISE Dera Ghazi Khan |
| 9 | BISE Sahiwal |
How to Download the PDF
- Scroll to the download button below this section.
- Tap or click the “Download PDF” button.
- Your Class 9 Biology Chapter 11 notes PDF will start downloading automatically.
- Open the file in any PDF reader — no sign-up or login required.
[ Download Class 9 Biology Chapter 11 Notes PDF ] — CTA button placeholder
Why These Notes Are the Best Choice
- Updated according to the new 2025-26 Punjab Textbook Board syllabus
- Covers MCQs, SQs, LQs, and exercise in a single PDF — no need to search multiple sites
- Includes the Mean vs. Median vs. Mode comparison and Measures of Dispersion topics often missing elsewhere
- 100% free to download, with no registration required
- Valid for students of every Punjab board, not just one city
Frequently Asked Questions (FAQs)
How can I download Class 9 Biology Chapter 11 notes PDF?
Simply click the download button on this page. The PDF will start downloading immediately, and no login or payment is required.
Are these notes valid for all Punjab boards?
Yes. Since they follow the new Punjab Textbook Board syllabus (2025-26), these notes are valid for BISE Lahore, Rawalpindi, Faisalabad, Gujranwala, Multan, Sargodha, Bahawalpur, Dera Ghazi Khan, and Sahiwal.
What is the difference between mean, median, and mode?
The mean is the arithmetic average of all values, the median is the middle value when data is arranged in order, and the mode is the value that occurs most frequently in the data set.
Is Biostatistics the last chapter of Class 9 Biology?
Yes, under the new 2025-26 Punjab Textbook Board syllabus, Biostatistics is Chapter 11, the final chapter of the Class 9 Biology book.
Is this Class 9 Biology Chapter 11 notes PDF free to download?
Yes, the notes are completely free to download, and you do not need to create an account or share personal details.
Explore More Class 9 Biology Notes
Continue your revision with related chapters: Chapter 10 – Reproduction in Plants notes, and the complete Class 9 Biology notes for all chapters, both available in the same easy-to-download PDF format.